
Solar, wind, and transmission: three workflows on one network.
Energy infrastructure is spread across large areas, which is where autonomous data collection helps most. The three classes need different sensors and criteria, so we treat them as separate workflows.
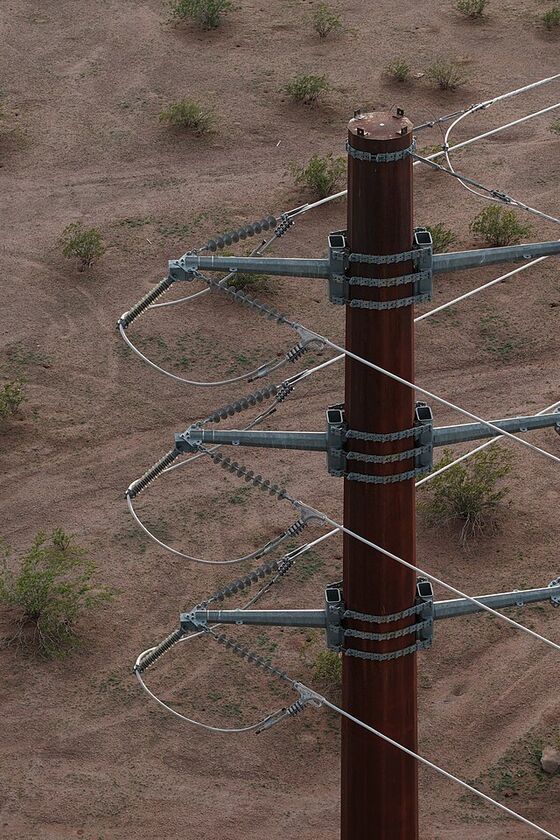
Transmission lines In development
LiDAR and imagery fused into a colorized point cloud of the line, with conductor clearance checks against published criteria.
The line is the hard part to assess: a drone-mounted LiDAR sees the structure and wires well, but may see little or no ground directly beneath them. We are building the analysis to account for that, and to say "insufficient data" instead of guessing.
- Conductor-to-ground and vegetation clearance
- Structure condition
- Georeferenced point clouds
- Items that still need a human check
- 01
Scope
The line or structures, the voltage and the criteria that apply, and what decision the assessment supports. Voltage matters, so we ask for it instead of assuming.
- 02
Capture
Autonomous flight along the corridor with LiDAR, camera, and positioning. Imagery colors the LiDAR points so the result reads like the real scene.
- 03
Register and analyze
Scans are fused into one georeferenced point cloud. Conductor clearance and vegetation encroachment are checked against published criteria where the scan can support a check.
- 04
Deliver
A point cloud, located findings with their evidence, and a list of items that still need a human check.
We are deliberately limiting automated checks to what a scan can support. Some items will stay manual checklist items, and clearance is reported as scanned, which may differ from conditions at maximum sag or load.
Solar Open to pilots
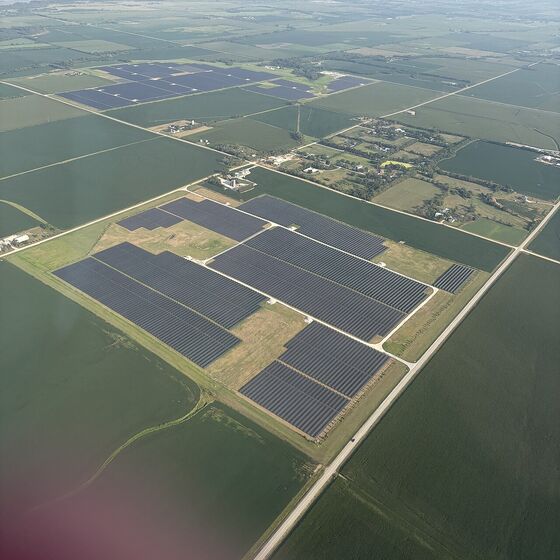
Array-level thermal and visual data to help locate underperforming or damaged equipment across large sites.
Solar sites are large and uniform, which suits autonomous capture. What owners need from an assessment varies: some want performance anomalies located, others want physical damage or vegetation documented for warranty and insurance conversations.
- Thermal anomalies across modules
- Physical damage and soiling
- Mounting and tracker condition
- Vegetation and site access
Site map with located anomalies
Thermal and visual findings placed on a site-wide map, so crews know where to go.
Physical damage documentation
Imagery of cracked modules, damaged mounts, and trackers with locations.
Comparison across visits
See whether an anomaly is new, worsening, or already repaired.
Wind Open to pilots
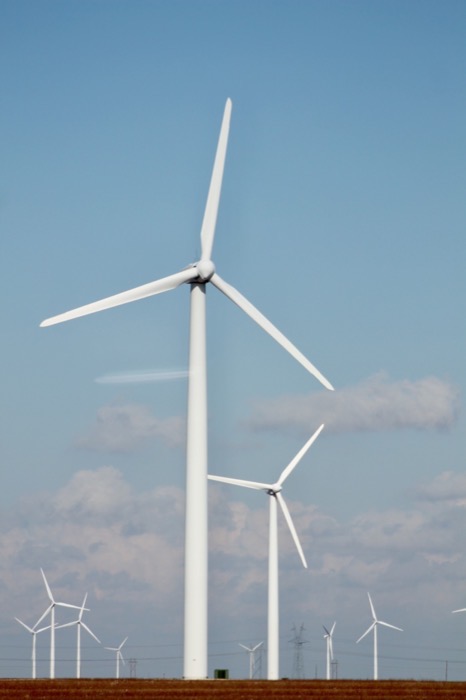
Blade and tower surface imagery captured without rope access, organized by turbine and component.
Turbine blades are expensive to inspect with rope access and are tall enough that a ground view misses detail. Autonomous capture could document each turbine the same way every time, which makes inspections comparable across a farm and across years.
- Blade surface damage
- Tower and nacelle condition
- Imagery organized by turbine
- Comparison between inspections
Where a manufacturer, utility, or standard defines the inspection you need, tell us. It determines what a useful deliverable is.
What we still need to learn from owners
Energy owners buy assessments in very different ways, which is why we are asking before building.
- What triggers an inspection today: a schedule, a warranty event, an insurance requirement, a failure?
- Who does it now (in-house, a vendor, the manufacturer), and what do you receive?
- What would you need in a deliverable to hand it straight to a maintenance crew?
- For transmission: which criteria and voltages matter most for your lines?
- Would you buy one assessment at a time, or only as part of a portfolio program?
Photo credits: transmission pole by Rsparks3 (CC0) and solar farm aerial by AllTheUsernamesAreInUse (CC0), both via Wikimedia Commons. They are illustrative and are not Argis Labs assets or customer sites.


Tell us about your assets.
Tell us what you manage and what you need to assess. If it isn't something we can do yet, we would still like to learn what it should take.
Start a Conversation